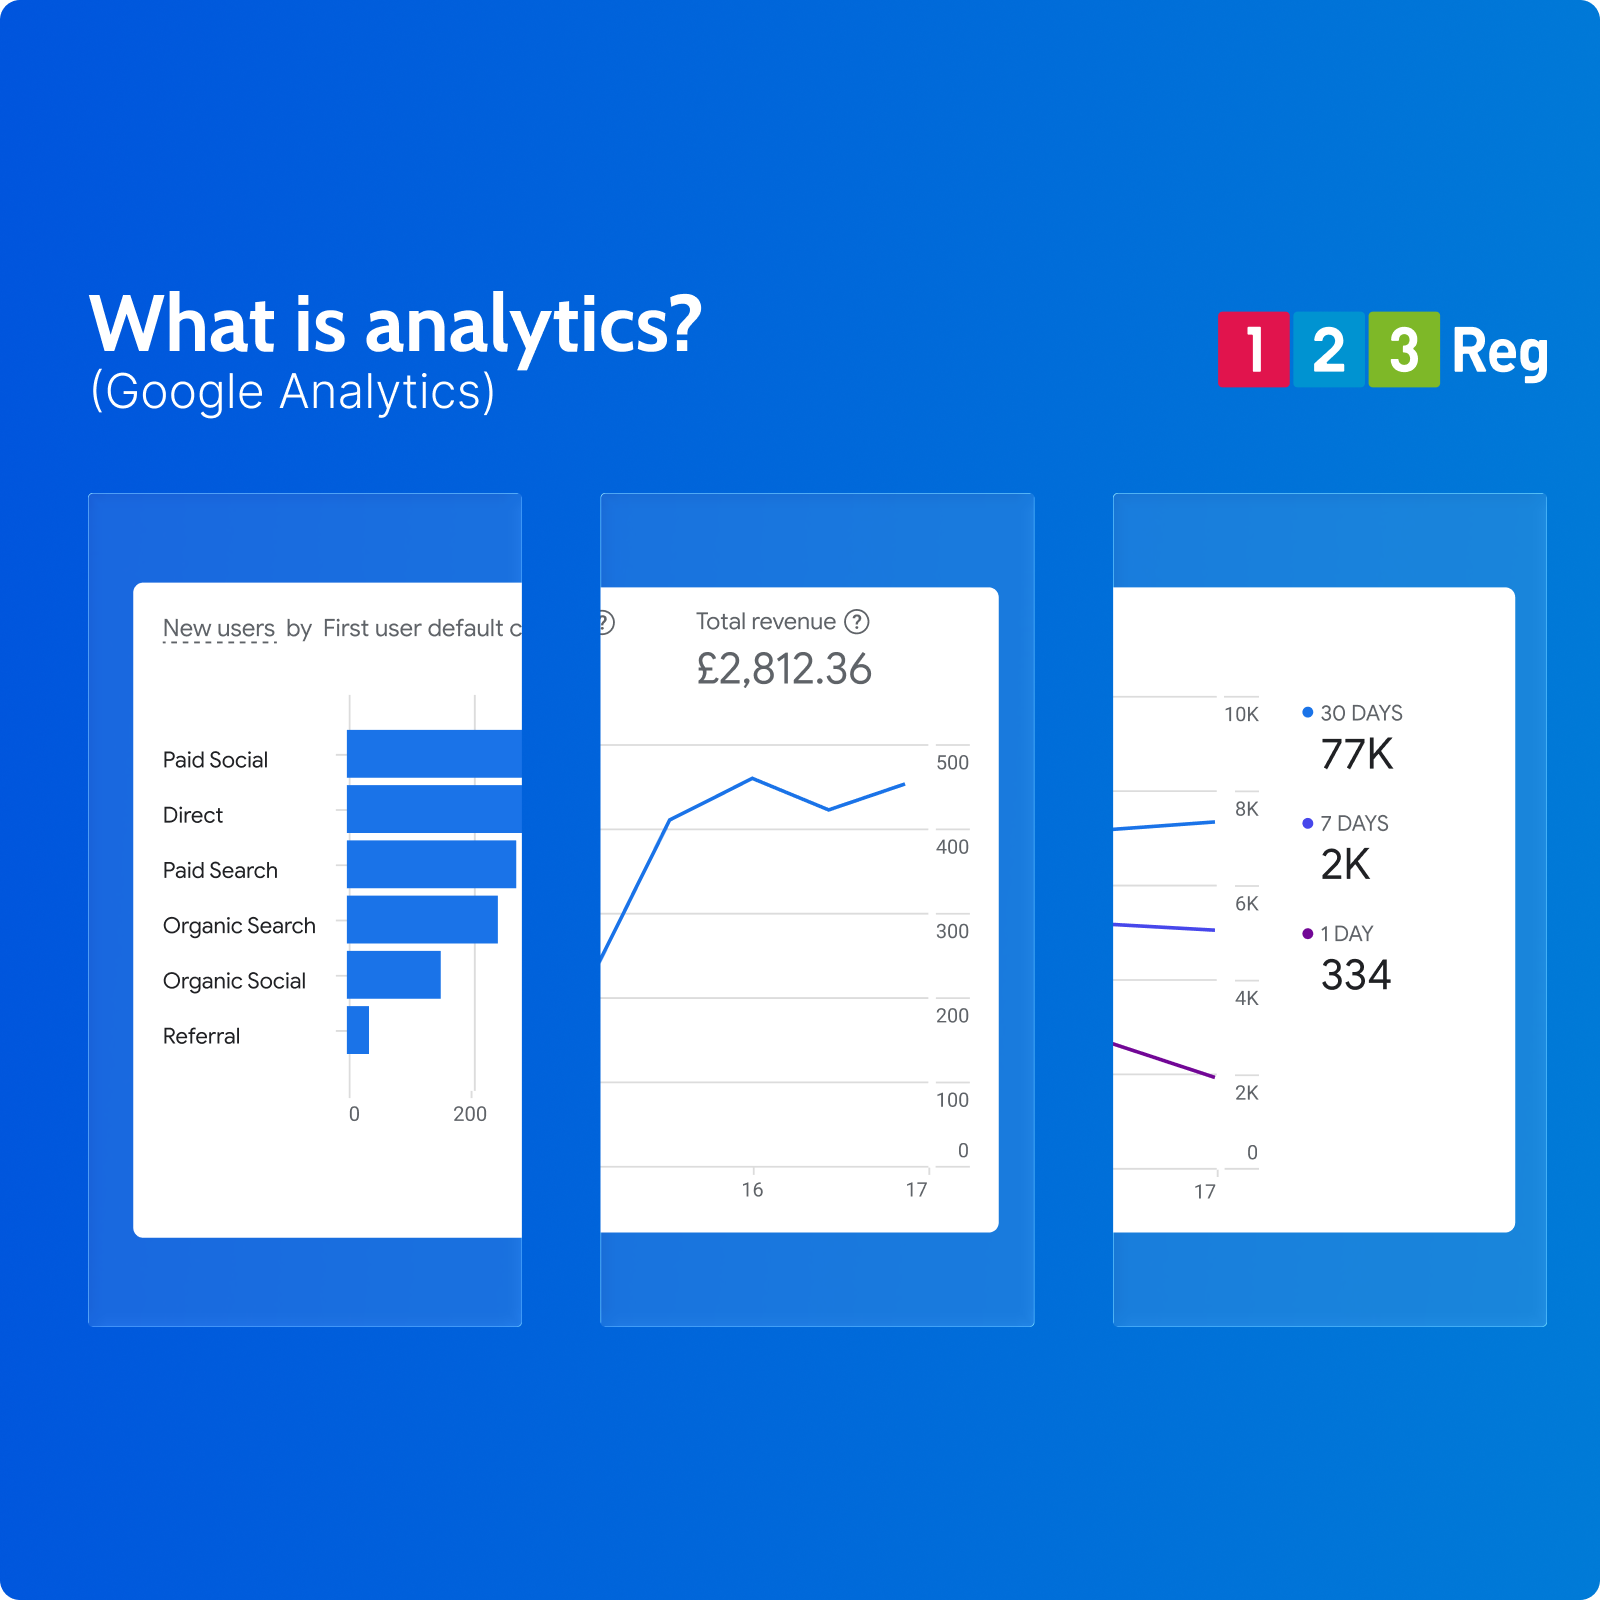
Google Analytics is a free in-browser app that helps you understand how your website is performing.
It goes well beyond counting hits. If you have an online business, you can learn how visitors move through your pages on their way towards making a purchase — or navigating away. The idea is to make make smarter, data-based decisions to improve your customers’ experience.
In this guide, we’ll run through the basics of getting started with Google Analytics and look at all the essential features.
Why analytics?
Website analytics help you understand what people are doing in your online space — what they like, what they don’t like, what makes them click.
The aim might be to offer a better experience for visitors and increase engagement. You can use the data to improve your site in a way that keeps visitors coming back for more.
For online businesses, the goal will be to drive sales and deliver the best possible bang-per-buck. By tracking metrics like conversion rates, time on page, and click-through rates, companies can make informed decisions to boost sales, increase brand awareness, and hit their targets.
In short: you’ll want analytics to achieve the best Return On Investment (ROI).
Welcome to Google Analytics 4
Google Analytics 4 (GA4) is a powerful in-browser platform for gathering traffic insights and more. It is the successor to Google’s previous tool, Universal Analytics (UA). They decided to bring back the classic name with this release, but the software is new from the ground up.
GA4 represents a big leap for website analytics. In particular, it’s much smarter when it comes to looking at user interaction with individual web pages. You can track how visitors scroll up and down pages and understand more about which pages take customer where.
And it’s totally free to use. There is a premium version, Google Analytics 360, but that’s designed for large enterprise with more complex data needs. GA4 is more than enough for most small to medium-sized businesses.
How does Google Analytics work?
GA4 gathers data from your website, your visitors, and Google Search. It then visualises the data in intuitive ways. It paints a vivid picture of how users engage with your site, with insights into their journey, from the moment they land on your page to the moment they leave (or, hopefully, make a purchase).
GA4 makes use of what Google calls ‘Signals’ – clues taken from device type, browser settings, and so on – to enrich data collection. Doing it this way, combined with machine learning, allows GA4 to fill in data gaps (think of it like gaps in the dinosaur DNA).
The idea is to understand the whole user experience. It sets out to do this through ‘event-based tracking’, including various user actions — from clicks and scrolls to video views and form submissions.
Importantly, it collects data without infringing on the privacy of individual users. Instead, it’s anonymised and built up a bit like a collage. Users aren’t snooped on directly.
GA4 can however collect more specific personal data when it comes to Ads Personalisation. By default, though, this option is set to off within everyone’s Google accounts.
What can I do with Google Analytics?
Imagine your business is an independent bookstore that sells books online.
Google Analytics can track how customers find their online shop through search. It can provide data on which genres or authors they browse. You can see how long visitors linger, for example, on book descriptions, and if they add any titles to their virtual cart. You can see how customers have discovered books — through blogs, online ads, social media posts, or simply from search results.
Armed with this information, you can figure out which marketing strategies are turning pages into profits and tailor the approach accordingly. Perhaps you need to highlight more staff picks on the homepage? Or run a special promotion?
The data is there to help you make smarter decisions — whether that’s redesigning the website navigation, promoting specific products, or launching a campaign. You can track the progress of promotions or campaigns as you go.
How do I install Google Analytics?
Since GA is a web-based tool, you can access it directly in your browser without downloading or installing anything — it’s just about getting it connected. To start, you’ll need to open an account. You can use your existing Google account, if you like.
Then, it’s time to create a Property. In Google Analytics, a Property represents an individual website or mobile app, and acts as a tab for organising all the information contained within it. You can create and manage multiple within one account. After logging into GA4, you’ll automatically get a Property created for your website or app as part of the initial setup.
The final element is your unique Tracking Code. This code allows Google Analytics to collect data from your site and is provided as an HTML snippet (looking like “G-XXXXXXXXX” or “UA-XXXXX-X”). This invisible tracker will need to go on all pages in order to work its magic.
Click here to visit Google’s own instructions on getting your site connected.
Thankfully, if you’re using Website Builder from 123 Reg, there’s an easy way to add your HTML snippet. Simply visit your website dashboard and click “Edit Website”. Once in, scroll over to “Settings” in the right side panel and find “Google Analytics”. Copy paste your code into the “Tracking ID” area. Hey presto.
Your changes will save automatically, but you’ll need to publish your website to make the Google Analytics tracking code active. Once that’s done, be patient! It can take up to 24 hours for data to start showing up in your GA4 account.
If you’re a WordPress user, you can add your tracking code either manually by editing your theme’s header.php file or with various free plugins.
Set up a Google Analytics demo account
For those new to Google Analytics, a new account linked to your Google account is automatically created, and a demo account is added to it for you to explore. Google’s tried and trusted demo give you hands-on chance to explore the world of web analytics with real business data from Google’s own Merchandise Store.
Demo account: Play around with data from the Google Merchandise Store
How do I use Google Analytics?
The Dashboard
Welcome to Google Analytics! We’ve been expecting you.
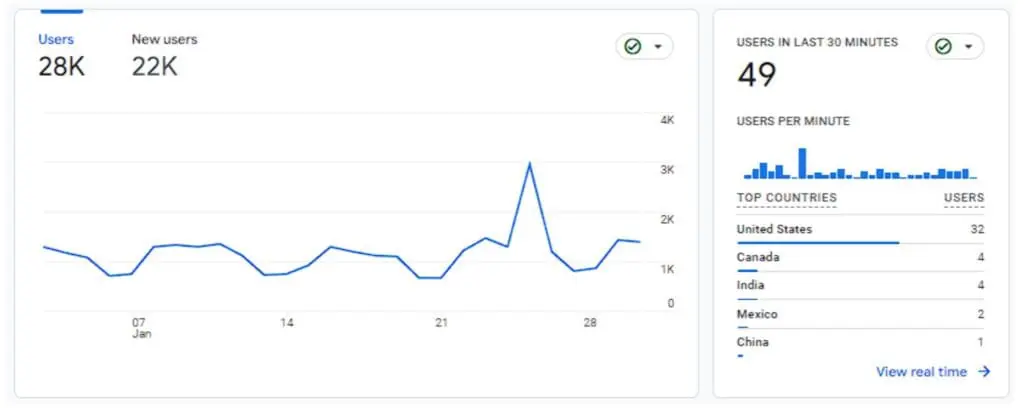
The first thing you’ll see is the dashboard, your home base for understanding website performance. You get an overview showing the key metrics like the number of visitors, where they’re coming from (search engines, social media, etc), and how long visitors are staying on your site.
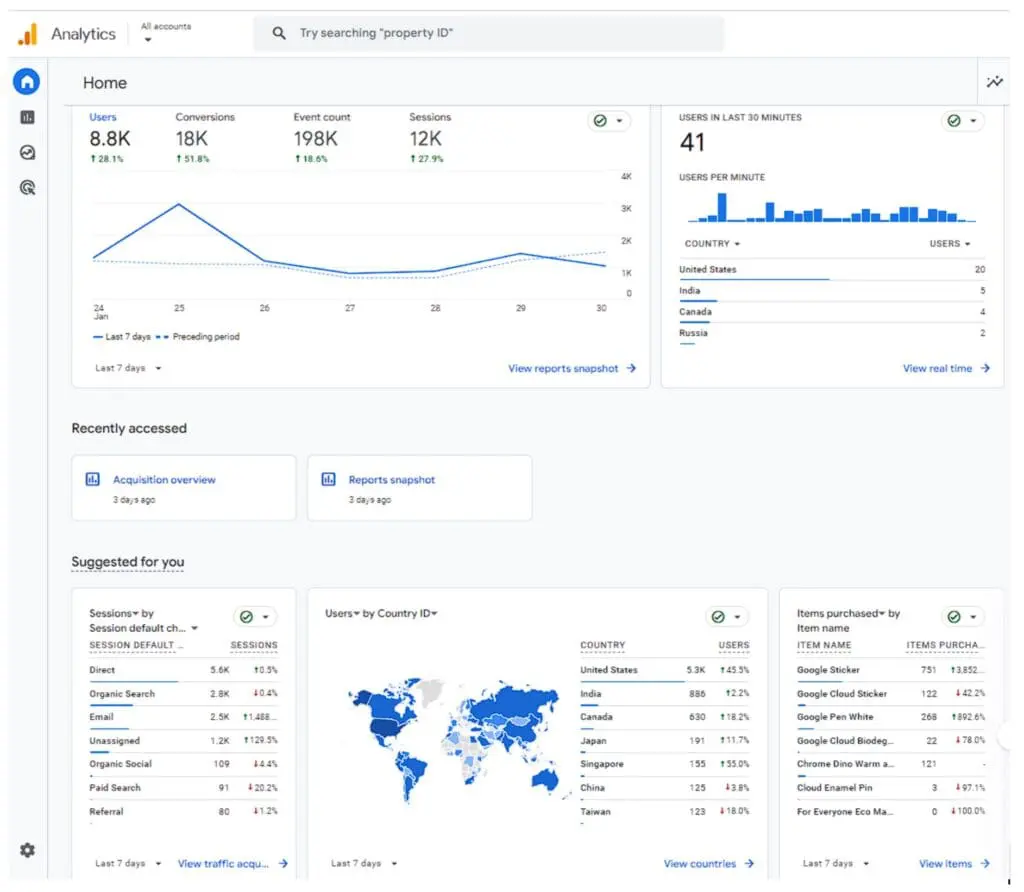
The dashboard is designed with a clean, simple look you can easily get to grips with. You can also personalise it to display the information that matters most to you.
Still, it can look a little overwhelming at first glance. The trick is to focus-in on those features you’re most likely to use. In a matter of seconds, you can gain all sorts of insights.
Main Sections
Within the sidebar to the left, you’ll see the four main sections. This your gateway to all the features within GA4:
Home: Your home base and main overview.
Reports: This is where you dive deeper into your website data. See how users find your site, what they do on it, and if they come back.
Explore: Where you can make custom reports and explore specific data.
Advertising: For insights into marketing efforts and how users interact with ads.
Reports and Metrics
While the Home section gives you a quick overview of your website’s performance, the Reports section allows you to dive deeper into specific areas, such as your audience data, how they find you (acquisition), what they do on your site (engagement), and how you’re making money (monetisation).
GA4 offers two types of reports to help you understand your website data: Standard and Custom.
Standard Reports are pre-made reports provide a snapshot of your website’s essential information. These give you a general idea of how your website is performing and where users are coming from. They include metrics like pageviews, sessions, new visitors, traffic sources, bounce rates, cost of conversion, and time on page.
For a more tailored analysis, you can create Custom Reports to track the specific metrics and dimensions that matter most to you. This gives you the flexibility to dive deeper into your data and answer specific questions about your website’s performance.
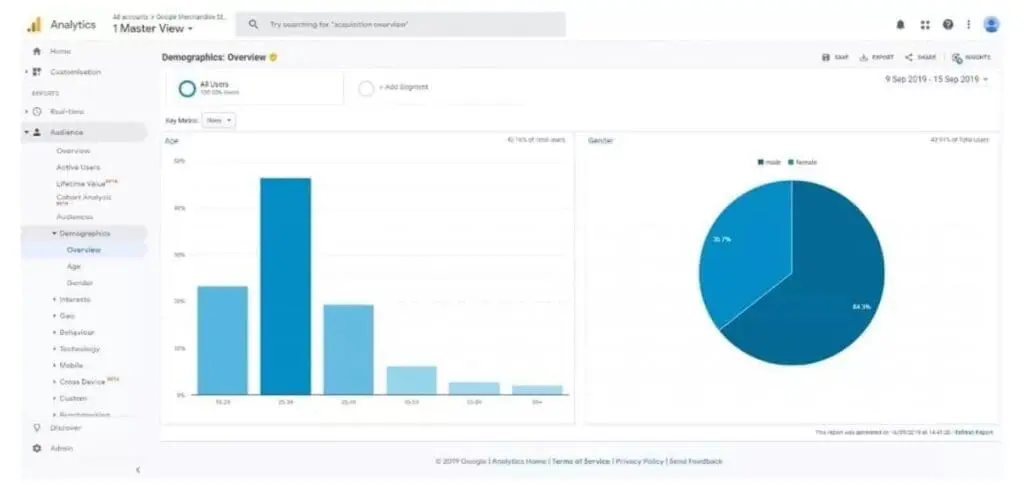
Audience Reports
Audience Reports tell you who your visitors are. This can help you gear marketing and website content to them. Audience reports show details like:
Demographics: Age, gender, and other characteristics of your audience.
Tech: What devices and browsers your visitors use.
Interests: What your audience is interested in.
Engagement: How much time people spend on your site and how they interact.
Note: You won’t see Audience Reports if you’re using the Google demo account.
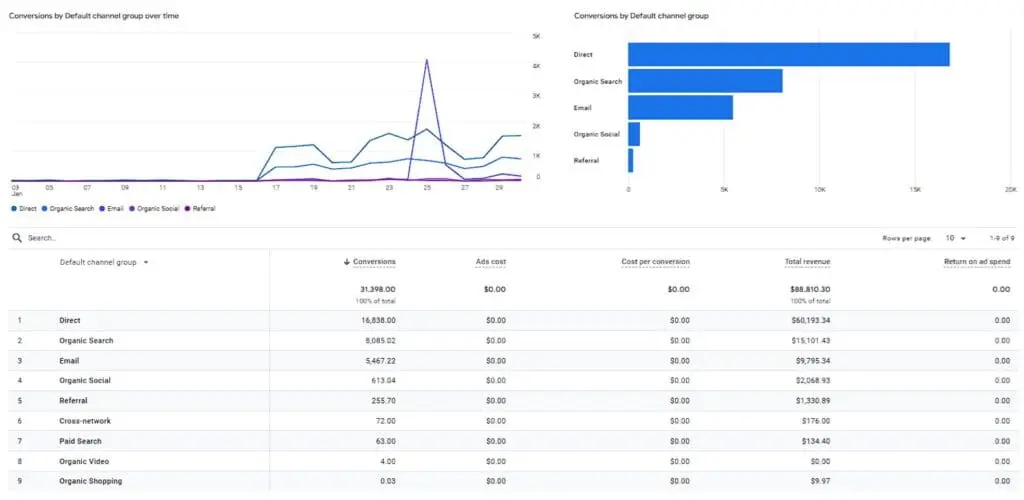
Acquisition Reports
Acquisition Reports are about showing how people find your site. For example:
Traffic Sources: Show where your visitors come from, such as search engines, social media, referrals, or direct visits.
Channels: Categorise your traffic into channels like Organic Search, Direct, Social, and Paid Search, helping you identify the most effective sources.
Campaigns: Track the performance of your marketing campaigns, including clicks, impressions, and conversions.
Keywords: Provide insights into the keywords driving traffic and conversions.
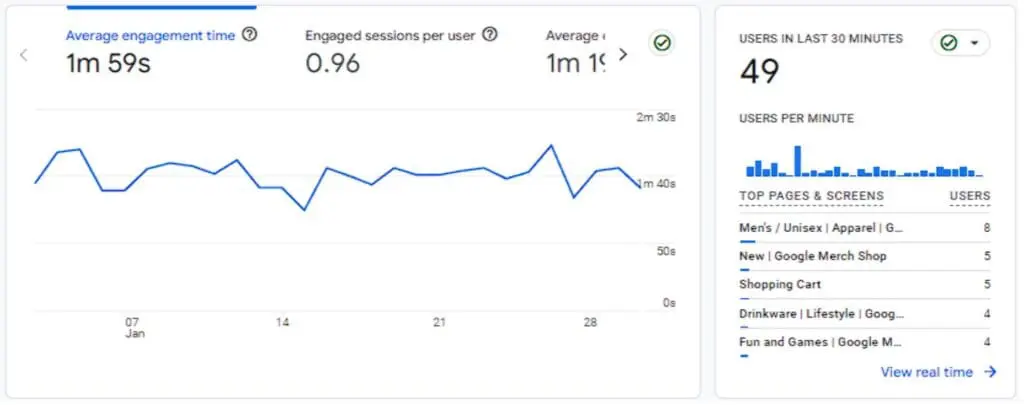
Engagement Reports
Engagement Reports within GA4 provide a deeper look into how users interact with your website. They offer insights into the actions users take on your site, the pages they visit, and how long they stay. This information helps you understand what works with your audience (and what doesn’t).
Events: What people do on your site, whether that’s clicking links, watching videos, or completing forms.
Engagement: Insights into how interested visitors are by seeing how many pages they look at, how long they stay, and whether they quickly leave.
User Explorer: Explores what individual visitors do on your site, so you can see how different people use your site in particular ways.
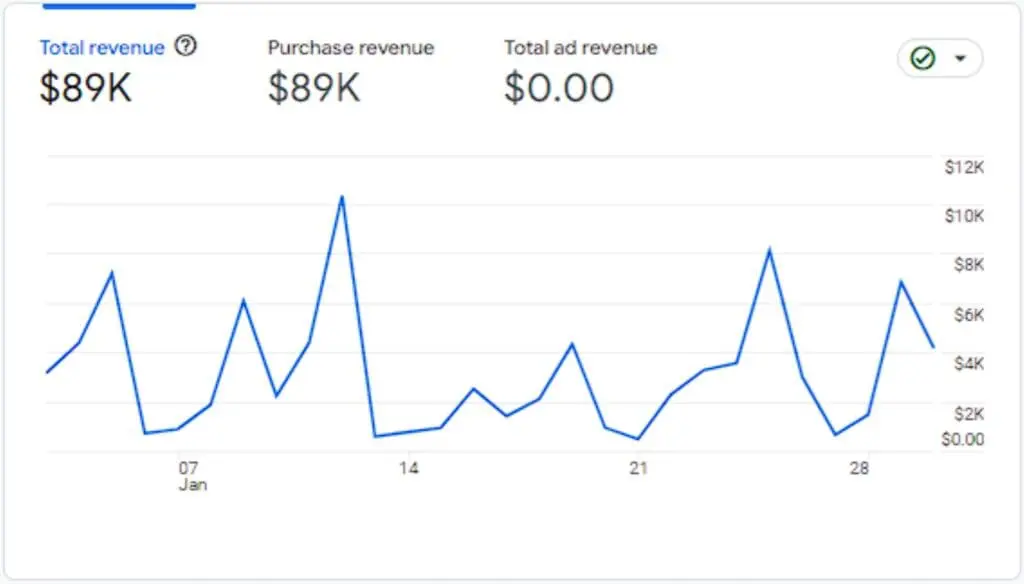
Monetisation Reports
A new feature in GA4, monesation reports offer insights into how your website or app is generating revenue. These reports provide valuable data on transactions, product performance, and the effectiveness of specific promotions.
For instance, you can see how different product promotions impact sales and identify which consumer segments are contributing the most to your bottom line.
E-commerce: If you run an online shop, these reports show you how your business is doing financially, including total revenue, number of items sold, and which products are your top sellers.
Conversions: Keep an eye on the actions that are most important to your business, like people subscribing to your newsletter, buying products, or completing other goals you’ve set.
Purchase Probability: This report uses advanced machine learning models to predict the likelihood of customers making future purchases based on their past behaviour on your website.
Sharing your Google Analytics reports with your team is easy. You might also come across reference to the idea of “Sharing Reports,” but really this doesn’t really refer to a specific category. You can share any report with colleagues or contacts, given the right permissions.
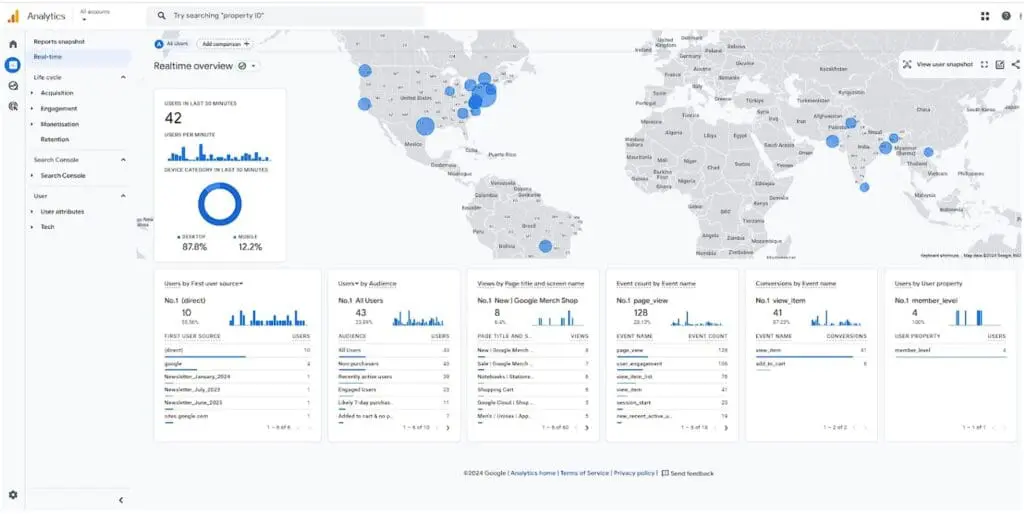
Real Time Reporting
Real-Time Reporting in GA4 is a feature that provides you with up-to-the-minute information about what’s happening on your website.
While real-time reporting isn’t entirely new to Google Analytics, GA4 has significantly improved it with detailed tracking and a user-friendly interface (you even get your own global command centre, Bond villain-style map overview!)
Here, you can check out how many people are currently visiting your site, where they are located, the pages they are viewing, and even the actions they are taking — all in real time. For example, live reporting can show a surge in traffic upon a new product launch or promotion.
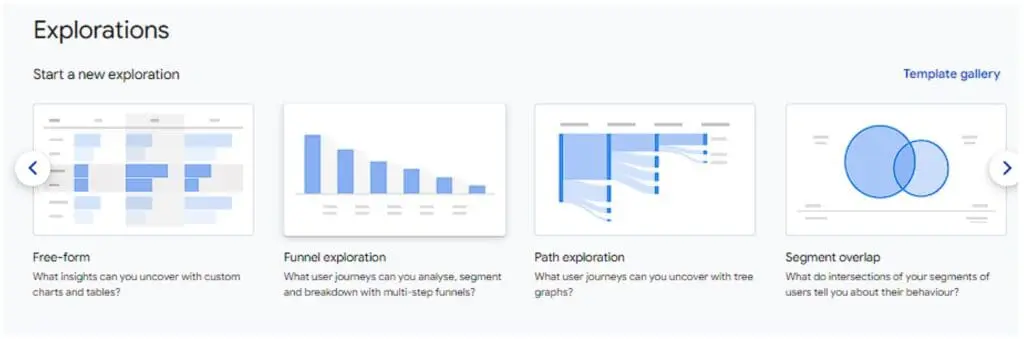
Explore
The Explore section lets you create custom reports to answer specific questions you have about your business, while the Advertising section helps you track how your ad campaigns are performing.
Explore allows you to create custom reports and visualisations to analyse your website’s data in greater detail. You have the flexibility to choose the specific metrics and dimensions you want to see and visualise them using various charts, graphs, and tables.
You can apply filters to focus on specific segments of your audience, compare different groups of users, and select specific time periods to gain a deeper understanding of how users interact with your website and how it’s performing overall.
Together, the Explore and Advertising sections provide a comprehensive view of your website’s health, allowing you to identify areas for improvement, track your progress toward your goals, and ultimately make data-driven decisions that drive your business forward.
Advertising
The Advertising section is where you can track ad campaigns. It’s now integrated with Google Ads, giving a full overview of campaign performance all from one place. You can see how users interact with your ads and how much revenue they generate for your business.
For instance, if you’re running ads for your online shop, GA4 allows you to see how many people clicked on your ads and whether those clicks resulted in sales. You can use this data to make decisions about where to allocate advertising budget for the biggest impact.
Wrap up
Google Analytics empowers small businesses to make data-driven decisions. While we’ve only scratched the surface, hopefully this guide offers a solid grounding into the key features and how they can benefit your business. It’s amazing what you can achieve these days without a dedicated IT team! The best part is that it’s completely free, so there’s no risk in diving in and exploring what it’s made of. You’ll be well on your way to harnessing that data and growing your business.