
“I’ve always wondered,” said the woman with her hand up, “if people are even visiting that page on my website”.
I was doing a presentation about understanding your website visitors, at Enterprise Nation. We’d moved onto questions.
“Well do you have Google Analytics installed?” I asked.
“I do,” she responded, “but I’ve never really got to grips with it. I’ve logged in but I’m never quite sure what I should be looking at”.
It wasn’t the first time I’d heard that response. It’s a common story. It might even be something you’ve said yourself.
Because it’s free, most people install Google Analytics on their website, or at least get their web designer to do it. It’s a gesture towards doing the ‘right thing’ when setting up your site. Ticking the box that says ‘understand what’s happening on your site’.
And when most people log in for the first time they’re pleasantly surprised. They see a pretty graph with some simple numbers. It all looks quite straightforward.
However, usually that’s as far as it goes. Most people look at the first graph, and then aren’t sure what to do. Ask them a specific question like ‘where do your visitors come from’ and they don’t know which report to find.
It’s the same for all analytics platforms – believe me, I’ve tried most. Google is one of the easiest to use. The graphs are clear and the data is easy to manipulate.
But like any software package, if you don’t put the time in you won’t get the benefit.
And maybe there’s the problem. Which person running their own business has the time to pore over web analytics data?
If you’d like to get more out of Google Analytics, but haven’t got much time, then I hope this will help: I have put together my top Google Analytics ‘hacks’. Simple time saving tricks that will help you quickly understand what’s happening on your site. Oh, and if you haven’t installed Google Analytics yet, check out our guide to installing it here. You can also get a bit more advanced with our free Google Analytics training course.
1. Google Tag Assistant
I’m sure most people don’t actually install Google Analytics on their own website. We rely on our web designer to paste the code.
So how do you know that its actually been done? How can you tell if it’s working correctly?
One way of course is to start checking your analytics reports, but that doesn’t always work. If GA has only been installed on some pages but not others, how can you quickly find out?
Luckily there’s Google Tag Assistant – an extension for Google chrome.
Google Tag Assistant, available free from the Chrome Web store can tell you if your Google Analytics tags have been installed correctly on your site.
Once installed, this nifty tool just looks like a button on your browser toolbar. To operate, just click the button. You immediate get summary information about the Google Tags installed on the page you’re browsing.
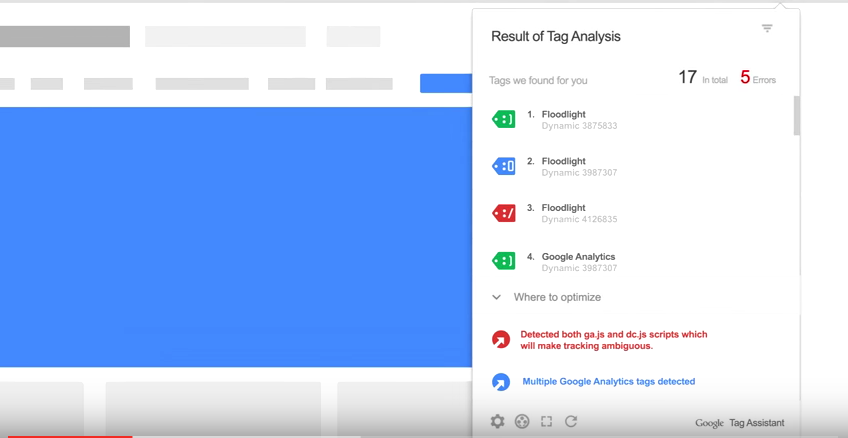
As an added benefit, the tag assistant can also tell you if your AdWords remarketing tag has been correctly installed. It’s a great way to get rid of the nagging doubt that the set up is wrong.
2. Page Analytics Chrome extension
Part of the challenge with Google Analytics is the time it takes to navigate to the site, log in, and then find the right report.
A great tool that takes the hassle out of that is the Page Analytics Chrome Extension. Just like the tag assistant, once installed this sits as a button on your Chrome browser toolbar.
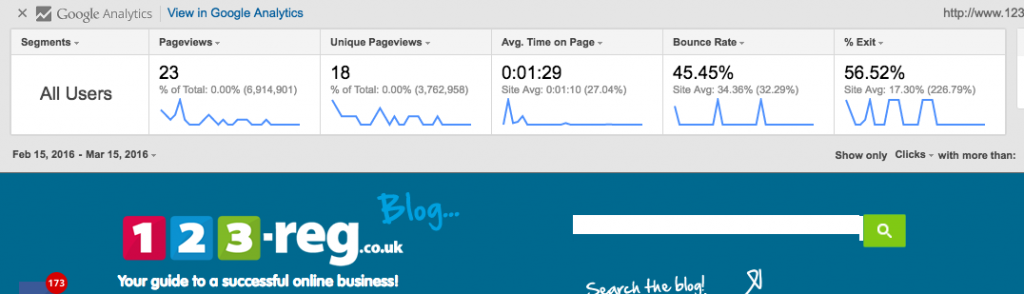
When looking at your site, clicking this button will instantly reveal stats about the number of people looking at that page right now.
If you expand with the double arrow drop down there’s lots more data from Google Analytics about how many people have looked at that page in the last 30 days, where they came from, and what they’re doing there.
You can instantly get a snapshot of how effective the page is by reviewing bounce and exit rate stats, and find out if visitors to the page are going up or down.
3. Whatagraph.com
When looking at your Google Analytics reports are you overwhelmed with the number of reports to look at?
Expand the left hand menu and there are well over 100 different reports you can drill into. And that’s before you’ve even started segmenting to certain traffic sources, or filtering by dimension.
That’s where Whatagraph steps in. This simple tool summarizes all your weekly data into a PDF and emails it to you.
A basic account costs $29 a month (there is a free trial) and all you need to do is sign up with your Google Analytics account, and Whatagraph sifts through all the reports and simplifies it all.
There’s useful commentary telling you what’s going well and where you should focus your attention going forward.
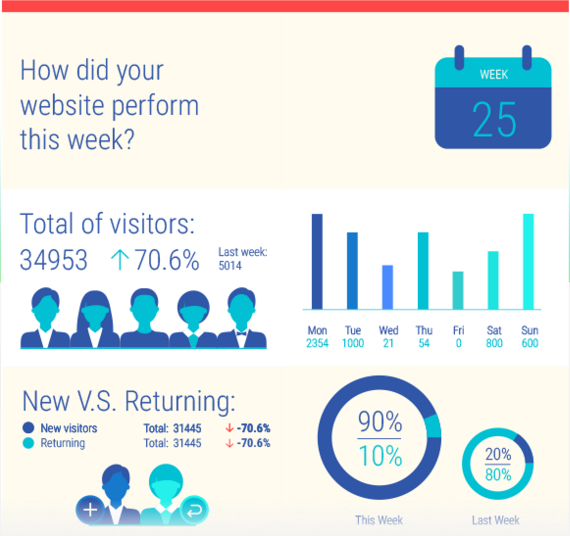
You also get a dashboard where you can review all your reports in one place.
4. Making shortcuts
I observe lots people trying to get to grips with Google Analytics, some of them more experienced than others.
Having started off at the very general level, most of us start to drill down to find answers to the specific questions.
You might be trying to find out more about your organic traffic from Google, or trying to understand how many people are visiting a particular page.
Over time we find 6 or 7 reports that we think give us a good understanding of what is going on. Sometimes these reports are quite detailed and take quite a few clicks, searches and filters.
What really amazes me is that having found the specific info we’re looking for, most people leave log out and carry on with the rest of their day. The next day they log back in and follow the same process of clicking, searching and filtering.
Quite apart from having to remember what you looked at the day before, this wastes so much time! I reckon 50% of the effort goes into finding the report, which only leaves you with 50% for analyzing.
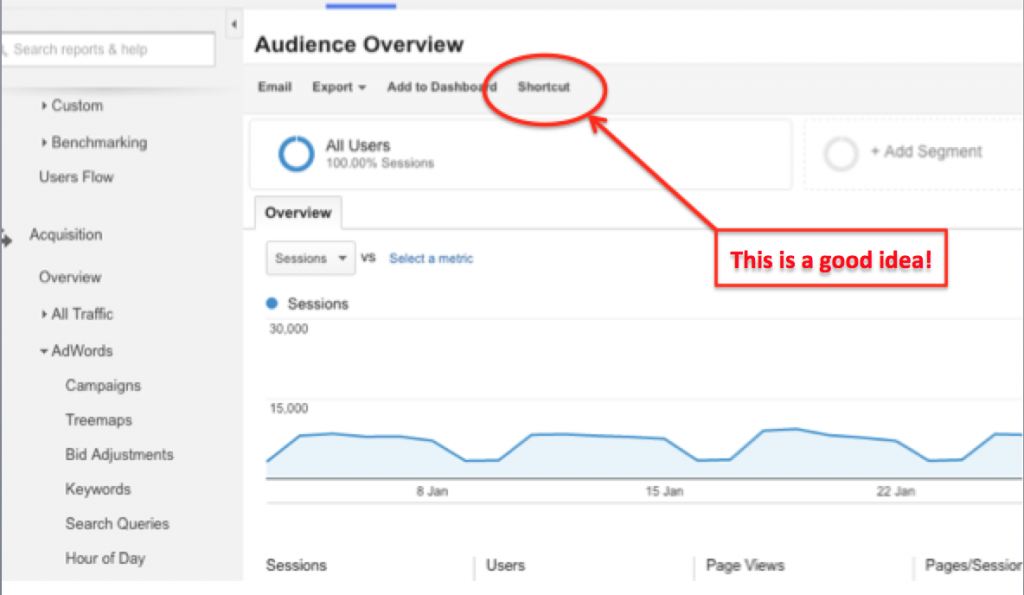
Google Analytics has a great button called ‘shortcuts’, which sits above every single report. The next time you find the report you were looking for, and have filtered to the right information, click ‘Shortcut’. In the dialogue box give your report a name.
This instantly saves a link to the report in the ‘shortcuts’ menu right beneath the dashboard on the top left. Your days of searching and filtering are behind you!
5. Scheduled emails
In fact, if you always log into Google Analytics to look at the same reports, there’s an even quick solution than shortcuts.
Why not have the reports emailed to you instead? You can then read them in your own time, even offline or printed out. You can even automatically email them to any co-workers.
When you’ve found the report that you’ll want to see regularly, click the ’email’ button from the image above, rather than the shortcut.
In the dialogue box, choose the email address that you want the report sent to (yourself or others in your business); the format (I’d choose PDF); the frequency and the day of the week. Write a note in the text field to remind yourself what the report contains. This note will appear in the body of the email that arrives.
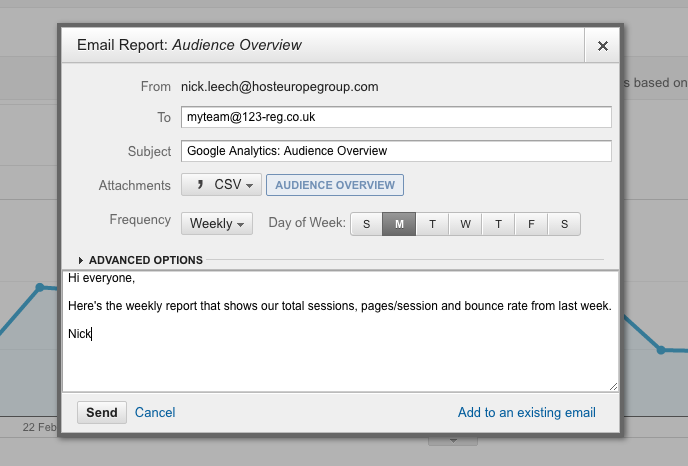
You can even add another report to the same email, so you’re not bombarded by multiple mails.
Once you’ve set it up, you’ll never need to log in again! Hours saved in just a few moments.
6. Annotations
Do you ever look back at your graph data to work out why you can see certain peaks and troughs? I don’t mean the weekly rise and fall of visitor numbers. I mean the times where you saw lots on one day. Or a flat spot.
At the time that these happen you often know why. It might be that you’ve exhibited at an event and lots of people have checked out your website. Or you have emailed your newsletter list and lots of people have clicked on the links.
But when you look back a few weeks later you can’t quite remember what happened. ‘What a great day – what did we do? Let’s try it again! If only we could figure out what happened!’
That’s where Annotations come in. Beneath every graph there’s a tiny ‘down’ arrow.
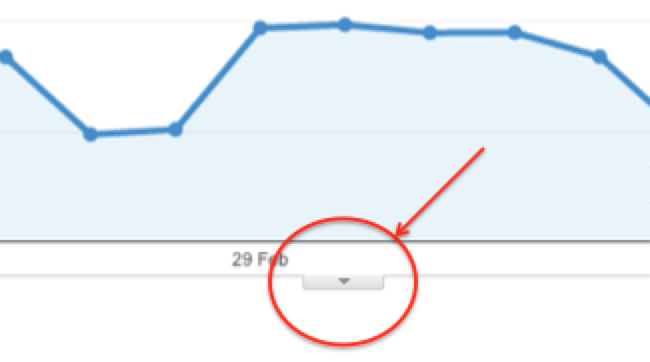
Click this and then click ‘Create new annotation’. Write a quick note about what happened on that day, to remind yourself.
When you look back on your data in weeks to come, you’ll see a small speech bubble beneath the graph. This tells you that you added an annotation. Clicking the bubble will reveal the note.
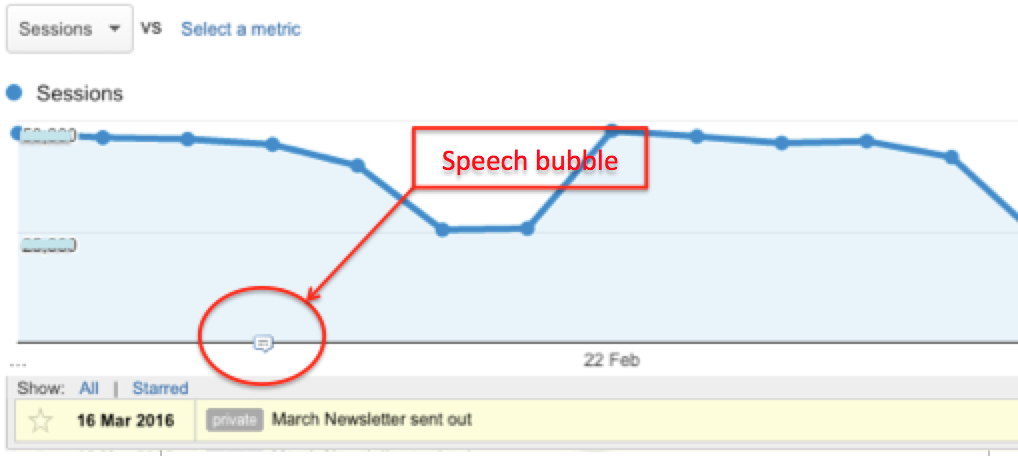
It’s a great record of what you did and the effects. Perfect for making better decisions going forward.
7. Custom alerts
Your business is going fine. The phone is ringing. The website is racking up the orders.
You’re busy! You haven’t had time to check out how the website is going recently. No chance to see how many visitors you’re getting, and where they’re coming from.
And then everything starts to tail off. Orders go down and you wonder what has changed.
Is someone down the road offering a better deal? Has your website gone down? Have your Google rankings disappeared overnight?
This is where Custom Alerts come in.
A custom alert will email you as soon as there is a significant change on your website. It’s a fantastic early warning sign that something is up, and needs to be investigated.
To set one up, click Admin and then under the ‘View’ menu click ‘custom alert’.
You can create an alert for almost any change in Google Analytics. The next time that change occurs, you’ll get an email. You can also have the alert emailed to others in your team.
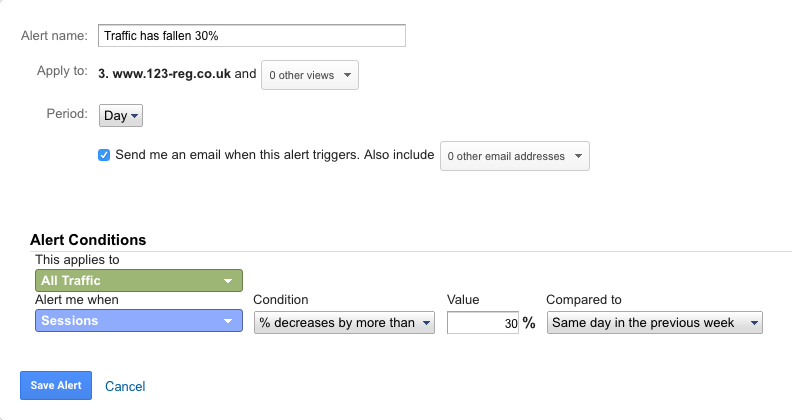
Just give the alert a name, say how frequently you want to be notified, and click the ‘send me an email’ check box. Then decide on what conditions should trigger the alert.
To remove the daily peaks and troughs, Google will compare your data to a similar period – either last week or last year.
This is one I’ve set up to let me know if traffic falls by more than 30% compared to the same day last week.
Here are a few ideas for alerts:
- Notify when your conversion rate falls by 25%. This will tell you if there’s a problem with your sign up funnel.
- Notify when your bounce rate goes up by 25%. This might be because you’ve changed some homepage content, or a new traffic source is spamming you
- Notify when traffic goes up by 25%. You’ll want to know what new thing is driving visitors, and if you should do more of it.
- Notify when visitors from social media goes up by 25%. Your social media strategy is paying off, it’s worth looking deeper to understand what’s working.
8. Dashboards
If you’re bewildered by the sheer number of reports; the options to segment the data; the dimensions you can use to slice it all; then simplify your life with a Dashboard.
Dashboards are an under-utilized feature in Google Analytics. They are a single one-page view of the most important metrics that you need to be focusing on. No more hunting through the left hand menus for the specific info that you want to see.
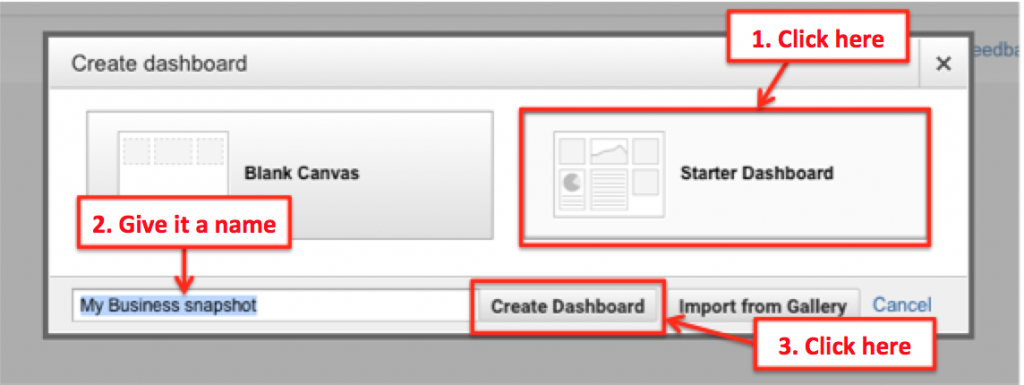
You can create your own dashboard by clicking “Customize” then ‘Dashboards’ and then ‘Create’ buttons on the top left hand of the Reporting screen. In the dialogue box click ‘Starter dashboard’, give your dashboard a name, and then click ‘create dashboard’.
Google Analytics then creates a single page dashboard with top line information¬. This includes the number of users, new users, where they are, bounce rate and revenue.
Each report is contained in a widget that you can drag around the page to rearrange in a layout that suits you.
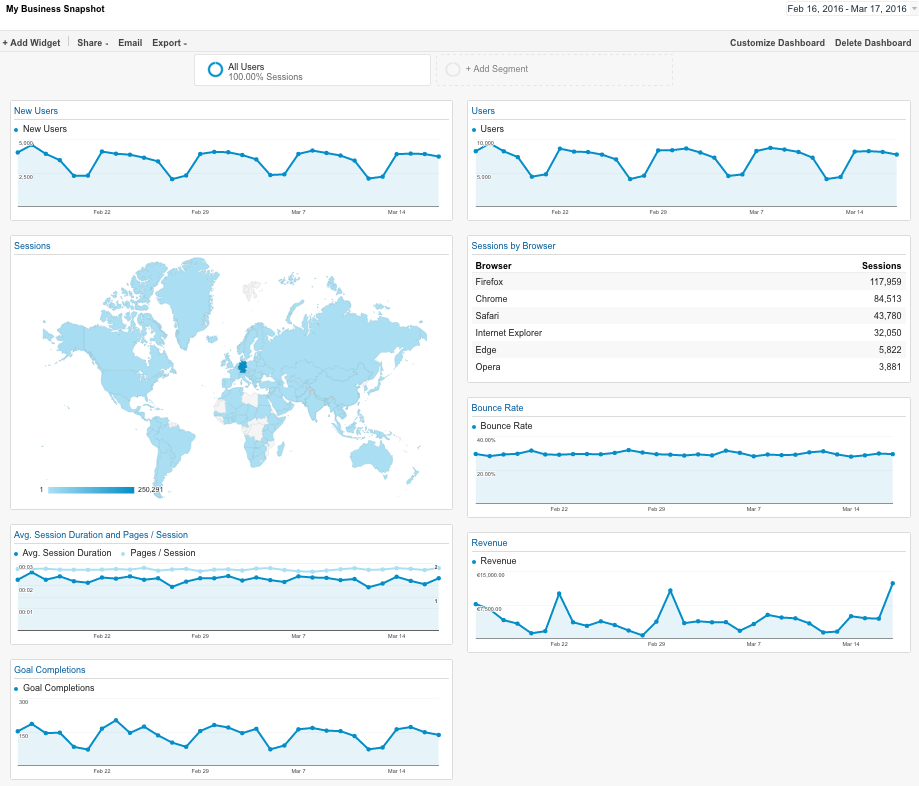
You can add more reports by clicking the ‘Add Widget’ button in the top left hand corner. You can remove reports by clicking the small X in the top right hand corner of each widget.
If this doesn’t give you a deep enough understanding of what’s going on then there’s good news. Some experts have done the heavy lifting by creating dashboard templates. All you have to do is grab one of their templates, and import it into your Google Analytics account, at the click of a button.
The type of expert dashboard that’s right for you depends on what sort of business you have, and which metrics you want to focus on. Here are some useful ones that might be right for you.
Perfect GA dashboard from Portent
This dashboard will give you a great overview on the revenue, the number of visitors, and where they are coming from. It also lets you know which content is the most popular.
Make sure you are logged into your Google Analytics account, and then just click the links below to import and see your own data in this dashboard.
This is a link for the Perfect Dashboard for ecommerce websites.
This is a link for the Perfect Dashboard for Lead Generation websites.
Blogging dashboard from Dashboard Junkie
If you run a blog and want to know more about your readers, then this is the one for you. It includes information about how people find your blog, the external links that drive traffic to your website, what your readers like reading about, and how your blog performs on a mobile.
This is a link for the Personal Blogger dashboard.
SEO dashboard from Koozai
If you are obsessed with ranking higher on Google then the SEO dashboard is the one for you. It gives you a good overview of your SEO performance, including organic visits; generic keyword visits, landing pages, bounce rates and conversions.
This is a link for the SEO dashboard.
How do you feel about Google Analytics now?
When it comes to understanding what’s happening on your site, Google Analytics is an invaluable tool. But it only really pays off if you put the time in. And none of us ever has enough of that.
That means we need to get by using time saving tricks. These can simplify the reports and give us instant access to key information. Hopefully these tricks will help you do that.
Still confused by Google Analytics? Ask your questions on Facebook or Twitter and we’ll do everything we can to help.


