Buying a domain name is like setting up a shopfront on the high street — it makes an impression before customers even step inside. For UK businesses, one of the big decisions is choosing between a .com or a .co.uk. They’re...
Thinking about taking your business online, but stuck between choosing a quick-start Website Builder and flexible Web Hosting? Both can help you build a brilliant professional site for your brand. The difference is how much control you want, how confident you...
Google Ads is a tool that can put your business in front of customers who are searching for what you offer. By far the world’s leading Pay-Per-Click (PPC) platform, it lets you run campaigns, track how they’re performing, and shake things...
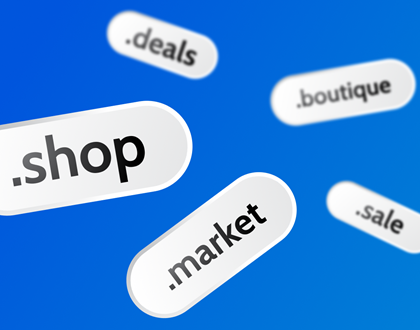
The Top-Level Domain (TLD) is the last part of your domain name — like the “.co.uk” in mybusiness.co.uk. But it’s more than a few letters after a dot. That little ending plays an essential part of your website’s identity, working as...
Microsoft 365 isn’t just about email and Office apps anymore — it’s about helping your business work smarter, with AI-driven tools that save time and make a real difference. With powerful features built into a growing range of optional add-ons, you’ve...
Your domain ending helps set the tone for your website before anyone clicks. It isn’t just a part of your web address — it can influence how professional and trustworthy your business appears in search results. With over 400 to choose...
Your imagination is your most valuable asset when it comes to starting an online business. It’s all about that great idea. You don’t need money in the bank or a computer science degree to make it happen. A spark of genius...
E-commerce is all about building online spaces where products can be offered to customers, 24/7. This article is written with the small business owner or solopreneur in mind. With platforms like Online Store Builder, launching a professional online store has never...
Have you ever wanted to start a business without a warehouse and mountains of stock? Dropshipping is a way for solopreneurs to sell products direct from the supplier. You take care of the marketing and sales; they handle the packing and...
It’s always exciting, starting an online business — but there are a few important decisions to make before you get going. One of the first is choosing the right business structure: should you...
Isn’t it frustrating when you come up with the perfect name for your business, run a search, and discover the domain is already taken? Worse still, the owner doesn’t even seem to be...
Search engine optimisation (SEO) is all about improving your website so that it appears higher in search engine results when people look for businesses, products, or services like yours. Broadly it’s about making...
You’ve got a name in mind for your business, project, or side hustle. The next step is simple: find out if it’s available to register. Checking takes seconds (literally) and even if your...
Did you know that when you buy a domain name, it’s often linked to a public record that can show who owns it, when it was registered, and when it expires? That record...
Domain names are the unique addresses that make websites easy to find online. You can think of them as house names on a virtual street. Not all domain names are created equal, though...
Isn’t it frustrating when you come up with the perfect name for your business, run a search, and discover the domain is already taken? Worse still, the owner doesn’t even seem to be...
You’ve got a name in mind for your business, project, or side hustle. The next step is simple: find out if it’s available to register. Checking takes seconds (literally) and even if your...
Did you know that when you buy a domain name, it’s often linked to a public record that can show who owns it, when it was registered, and when it expires? That record...
Domain names are the unique addresses that make websites easy to find online. You can think of them as house names on a virtual street. Not all domain names are created equal, though...
Dreaming of starting your own business online but dreading the price tag? Good news: you can get your domain included free for the first year* when you pick the right 123 Reg plan....
If you’ve bought a domain together with a 123 Reg plan like Website Builder or Managed WordPress Hosting, the chances are it’s already connected — so once you’ve hit publish, it should appear...
Search engine optimisation (SEO) is all about improving your website so that it appears higher in search engine results when people look for businesses, products, or services like yours. Broadly it’s about making...
If you’ve bought a domain together with a 123 Reg plan like Website Builder or Managed WordPress Hosting, the chances are it’s already connected — so once you’ve hit publish, it should appear...
Google’s new AI restaurant-booking experience is now live in the UK. Built on top of the existing ‘Reserve with Google’ tool, it lets people move from a natural-language search straight to a restaurant...
Running an online business today, big or small, the chances are many of your customers will be looking for answers from Google AI Overviews and ChatGPT before they ever click through to your...
Getting your business found online now means showing up twice: both in traditional search results and in the answers given by AI search assistants. More than ever it’s AI doing the searching on...
Getting your website noticed in search results starts with strong first impressions. Title Tags and Meta Descriptions are small but powerful elements that help search engines understand your pages — and persuade users...
It’s always exciting, starting an online business — but there are a few important decisions to make before you get going. One of the first is choosing the right business structure: should you...
For small-to-medium businesses, social media and your website work best when they work together. Social media grabs attention, and your website gives people somewhere clear to go next. Used well, the two can...
Google Ads is a tool that can put your business in front of customers who are searching for what you offer. By far the world’s leading Pay-Per-Click (PPC) platform, it lets you run...
Google’s new AI restaurant-booking experience is now live in the UK. Built on top of the existing ‘Reserve with Google’ tool, it lets people move from a natural-language search straight to a restaurant...
Finding a VAT number by company name is often easier than it first sounds, but it helps to know where to look. A few simple steps can usually point you in the right...
Cybersecurity myths are everywhere — and they can leave small business owners dangerously exposed. Many people assume hackers only care about big corporations or that basic antivirus software is enough to stay safe....
Google Ads is a tool that can put your business in front of customers who are searching for what you offer. By far the world’s leading Pay-Per-Click (PPC) platform, it lets you run...
Your domain ending helps set the tone for your website before anyone clicks. It isn’t just a part of your web address — it can influence how professional and trustworthy your business appears...
No one understands your business like you, but understanding your customers is an entirely different ball game. Even if you have some notion of who they are and how to cater to their...
Businesses today all face the challenge of holding onto customers in a fiercely competitive online world. With so many options just a click away, shoppers can easily switch to a rival offering a...
According to the latest report from creative agency, We Are Social, 56.2 million of us in the UK are active on social media—that’s 83% of the population! With such a massive audience to...
Google Analytics is a free in-browser app that helps you understand how your website is performing. It goes well beyond counting hits. If you have an online business, you can learn how visitors...


")