A beginner’s guide to Facebook and Twitter analytics
Social media is a great way to reach existing and potential customers, but how do you know if you’re getting things right? A quick glance at follower numbers and page like is a good place to start, but if you really want to know whether you’re making the right kind of impact on social media, you need to dig deeper.
Fortunately, Facebook and Twitter, two of the biggest social media platforms, offer in depth analytics. In this article we’ll look at what information you can access and how to use it to make sure you’re not wasting your time on social.
To access Facebook analytics, you’ll need to have set up a Facebook Page for your business. If you haven’t already done that, you can learn how here.
Once you’ve clicked the Insights tab you’ll be presented with a selection of graphs. But first, let’s consider what factors we should be measuring when we’re looking at Facebook stats.
Page Likes – The most obvious thing to monitor. It’s the number of people who have hit the “like” button on your page.
Post Reach – This is the number of people who have encountered one of your posts in their Facebook feed. The higher the number, the more people who have been exposed to your brand.
Engagement – This is the number of people who have liked, commented on, shared or clicked on your posts. Clearly, the higher the better.
The first page you encounter on Facebook Insights will look like this.
At the top there’s an overview of your headline stats for the last week. Given the short timespan being measured, you’ll probably find that the graphs fluctuate rather a lot. We’ll have a closer look at each stat below.
Under the graphs are details on how your last five posts have performed. You can also click to see all posts, allowing you to identify strongly performing posts at a glance.
Finally, you can add pages to watch. These should be competitors or companies trying to target a similar audience to yours. Here you get basic stats about how they’ve performed over the last week.
Likes
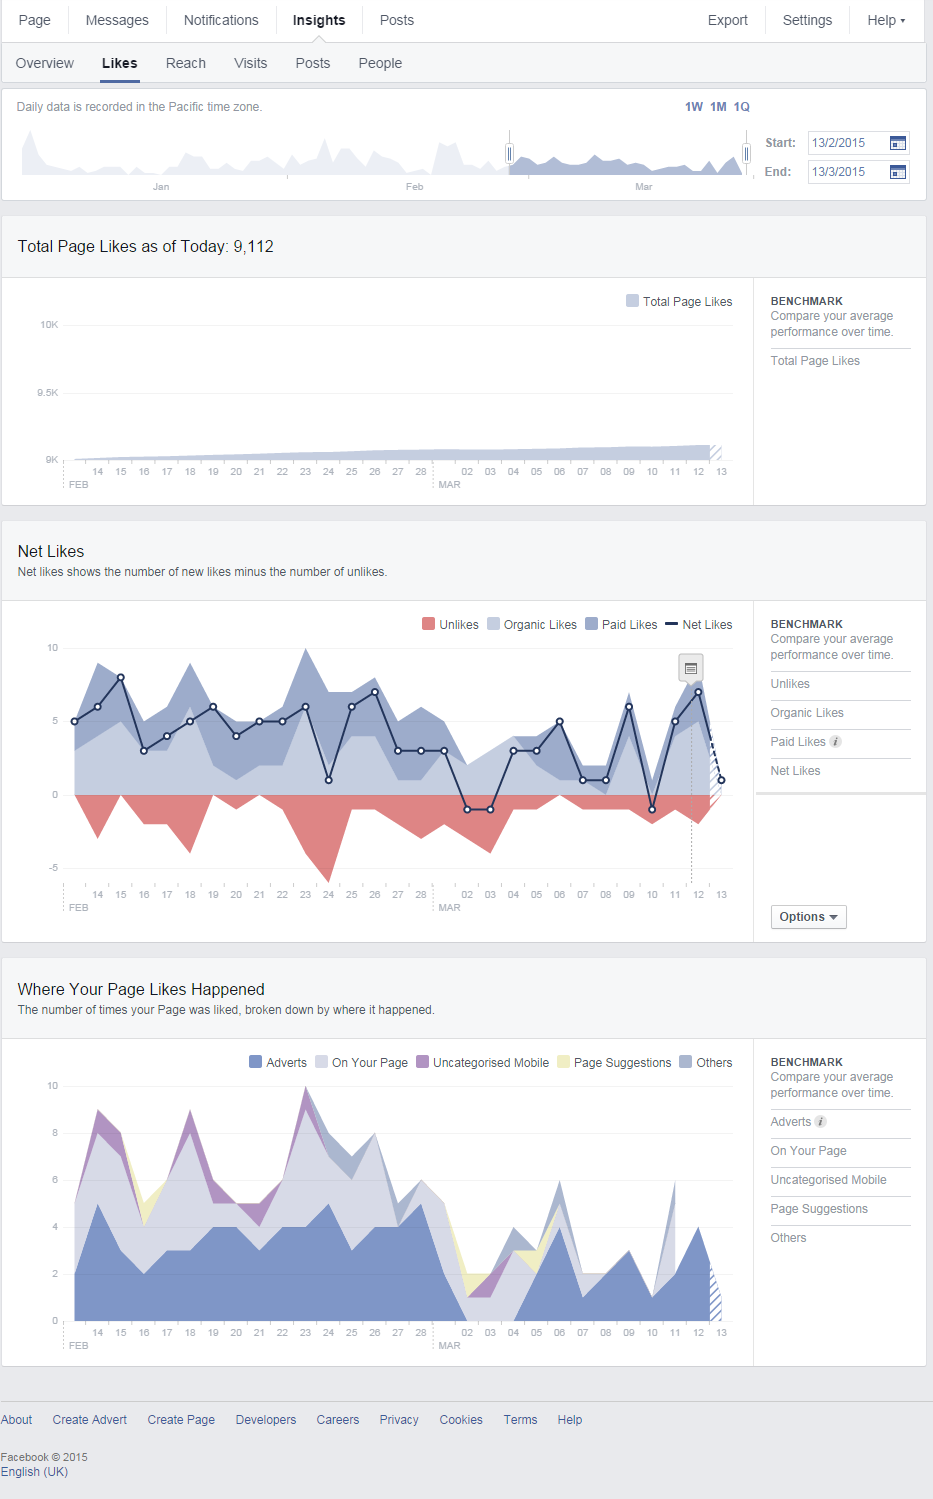
Next up is the likes tab. Here you can obtain more information about the number of people liking your page and where these likes are coming from. The graph at the top has an expandable date range, so you can see if your page is growing over the long term.
Below that is the net likes graph. Pay attention to spikes and troughs on the graph – take note of the date and go back to see exactly what lead to the increase in likes, or indeed what caused an increase in the number of unlikes. With this information, you’ll have a better idea of the kind of Facebook content your potential customers do or don’t want to see.
Finally on this page, you can see where your page likes happened. This is a good place to see whether your adverts are attracting page likes. If they’re not, consider a change in focus for your ads.
Reach
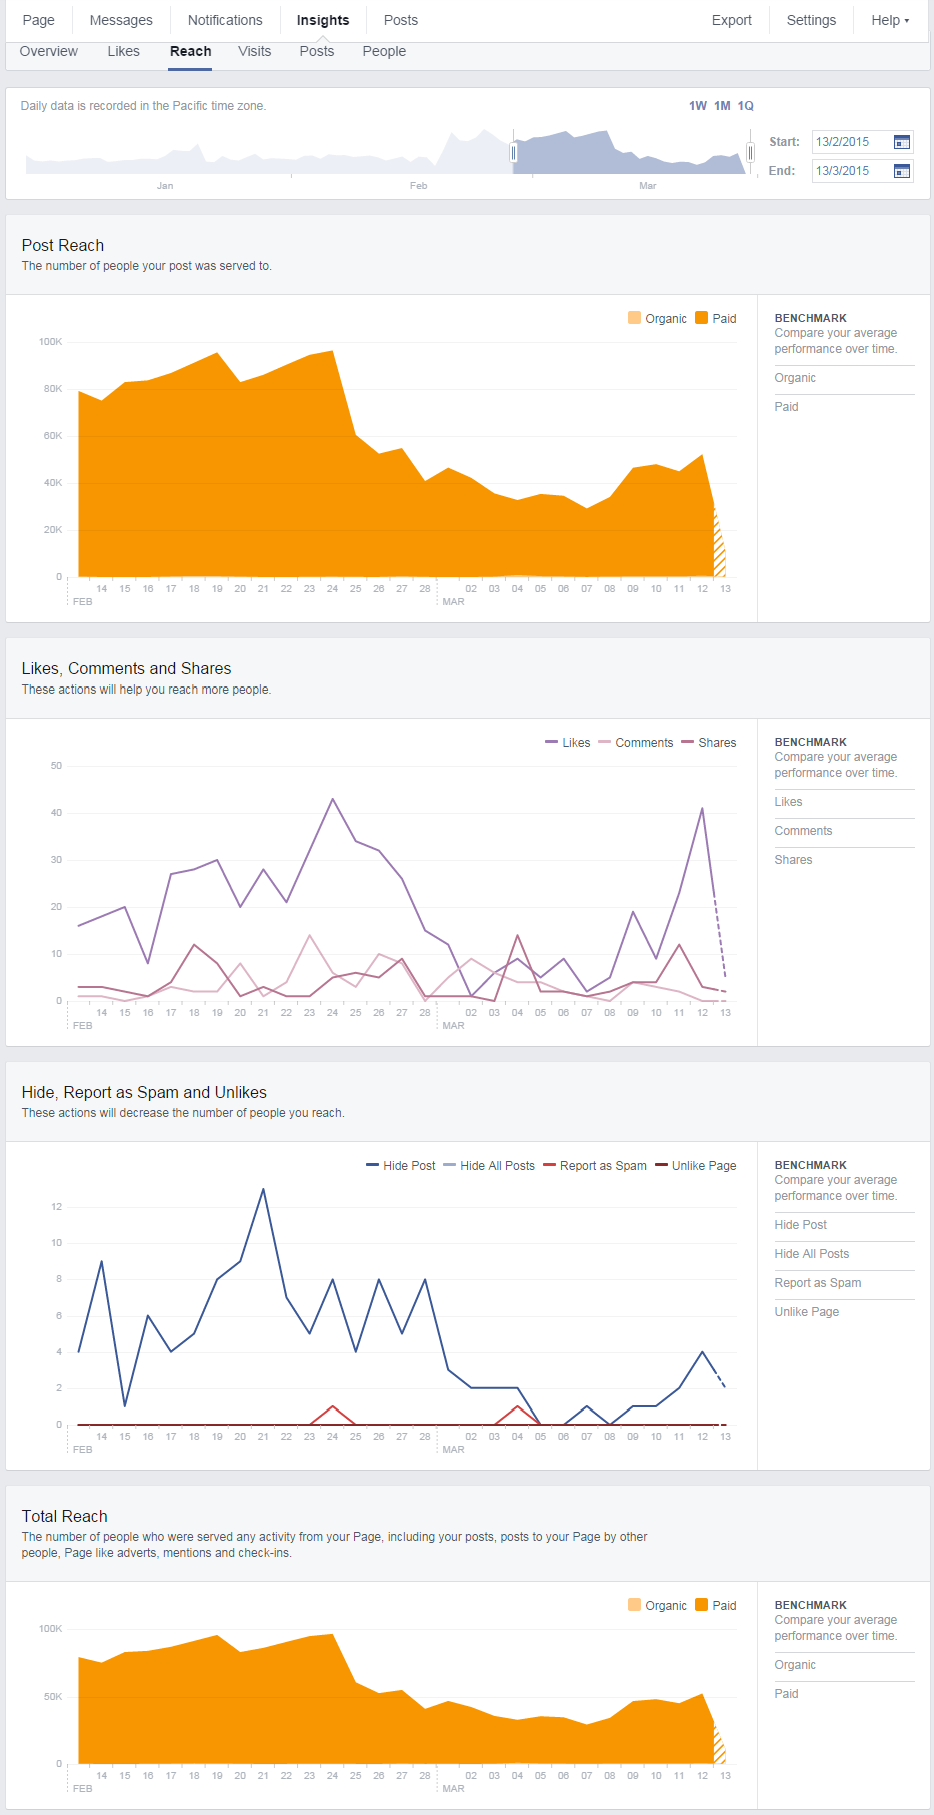
Moving on to the reach tab, here you can see the number of people who have seen your post. Because Facebook organic reach is now exceedingly low, this graph will either contain very little data, or be dominated by paid reach. For that reason, the biggest impact on this graph’s shape will tend to be how much you’ve spent on ads.
Of more interest is the likes, comments and shares graph below. Again, this will allow you to see if a particular piece of content has performed well. Note spikes and check back on your Facebook page to see what caused them, then produce similar content.
Hide, report as spam and unlikes are also a useful metric – although they indicate you’re probably doing something wrong. If someone has clicked “hide posts” it’s a sign that particular piece of content wasn’t relevant to them. Don’t worry too much about this, although if there is a big spike then you should put some thought into whether you want to produce similar content to the post that caused it again in future. Hide all posts, report as spam and unlike are more concerning. This indicates that people strongly dislike the content they’re seeing from you. A spike in any of these stats should be thoroughly investigated so you know what to avoid in future.
Visits
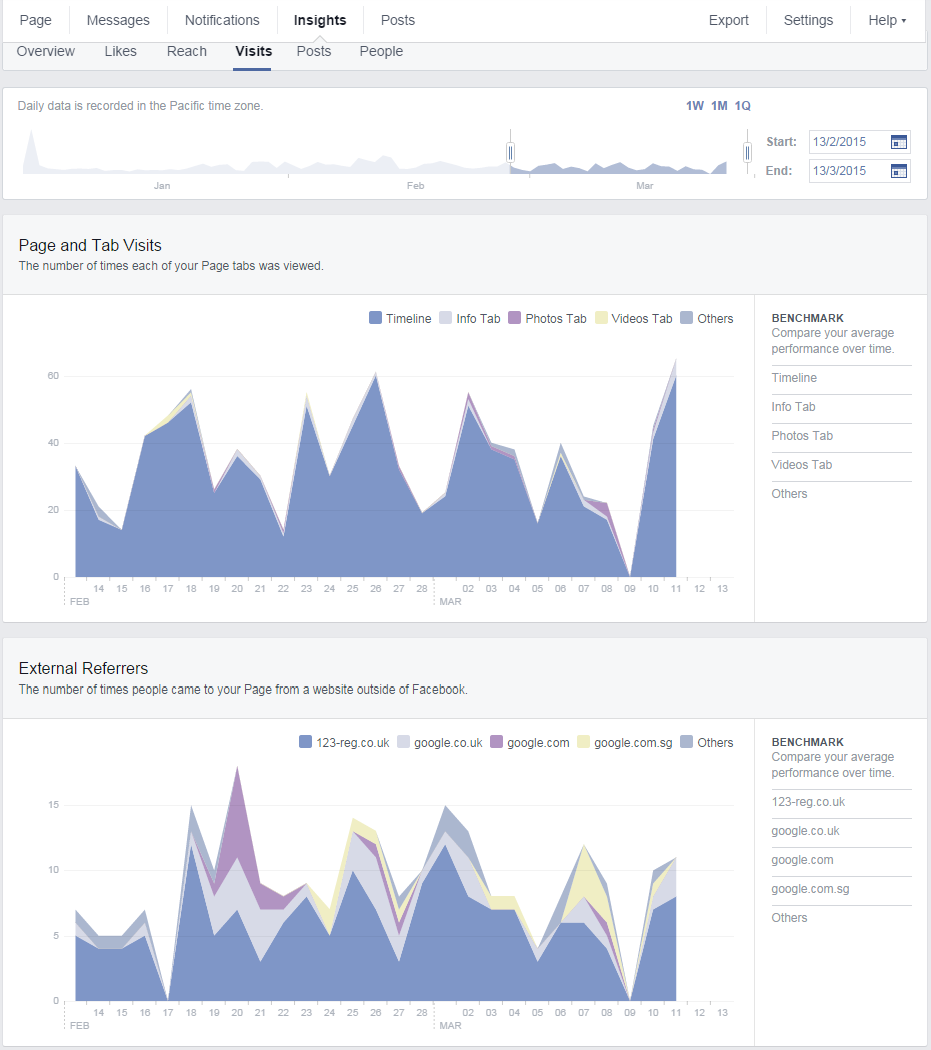
Visits doesn’t hold much information of use, although it’s good to see how people are finding your page. Your own website should be one of the top referrers. If it’s not, make sure people can easily find your Facebook page from your site.
Posts
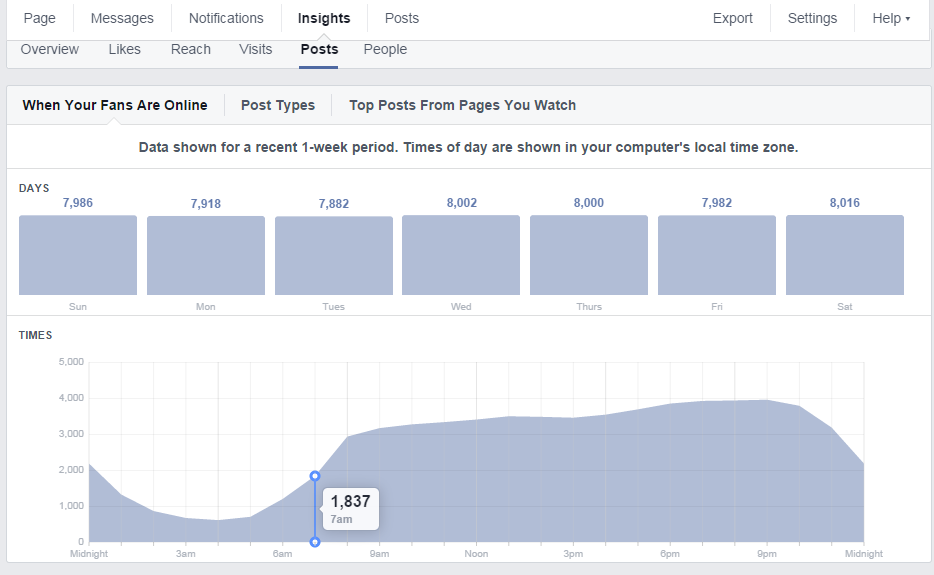
We’ve already looked at the information contained in the bottom half of the posts page, but this tab also lets you see when your fans are active on Facebook. Use this information to guide the timing of your posts – aim for the period with most activity.
On the post types tab, you’ll find information on how links, videos, status updates and photos have performed. Again, you can use this information to decide which kind of posts you want to focus on.
People
Finally, we have the “people” screen. This gives you a breakdown of the gender and location of your fans. This is most useful for checking if your posts are reaching the right demographic. For example, if you sell products in the UK, but most of your fans are based in other countries, then something is going wrong.
Anyone with a Twitter account can access Twitter analytics – just log in via a browser, click the drop menu located between the search box and tweet button, then select “Analytics”.
On Twitter, the main stats to pay attention to are:
Followers – The number of people following your account.
Impressions – The number of times your tweets are seen.
Engagements – Retweets, replies, favourites and other interactions.
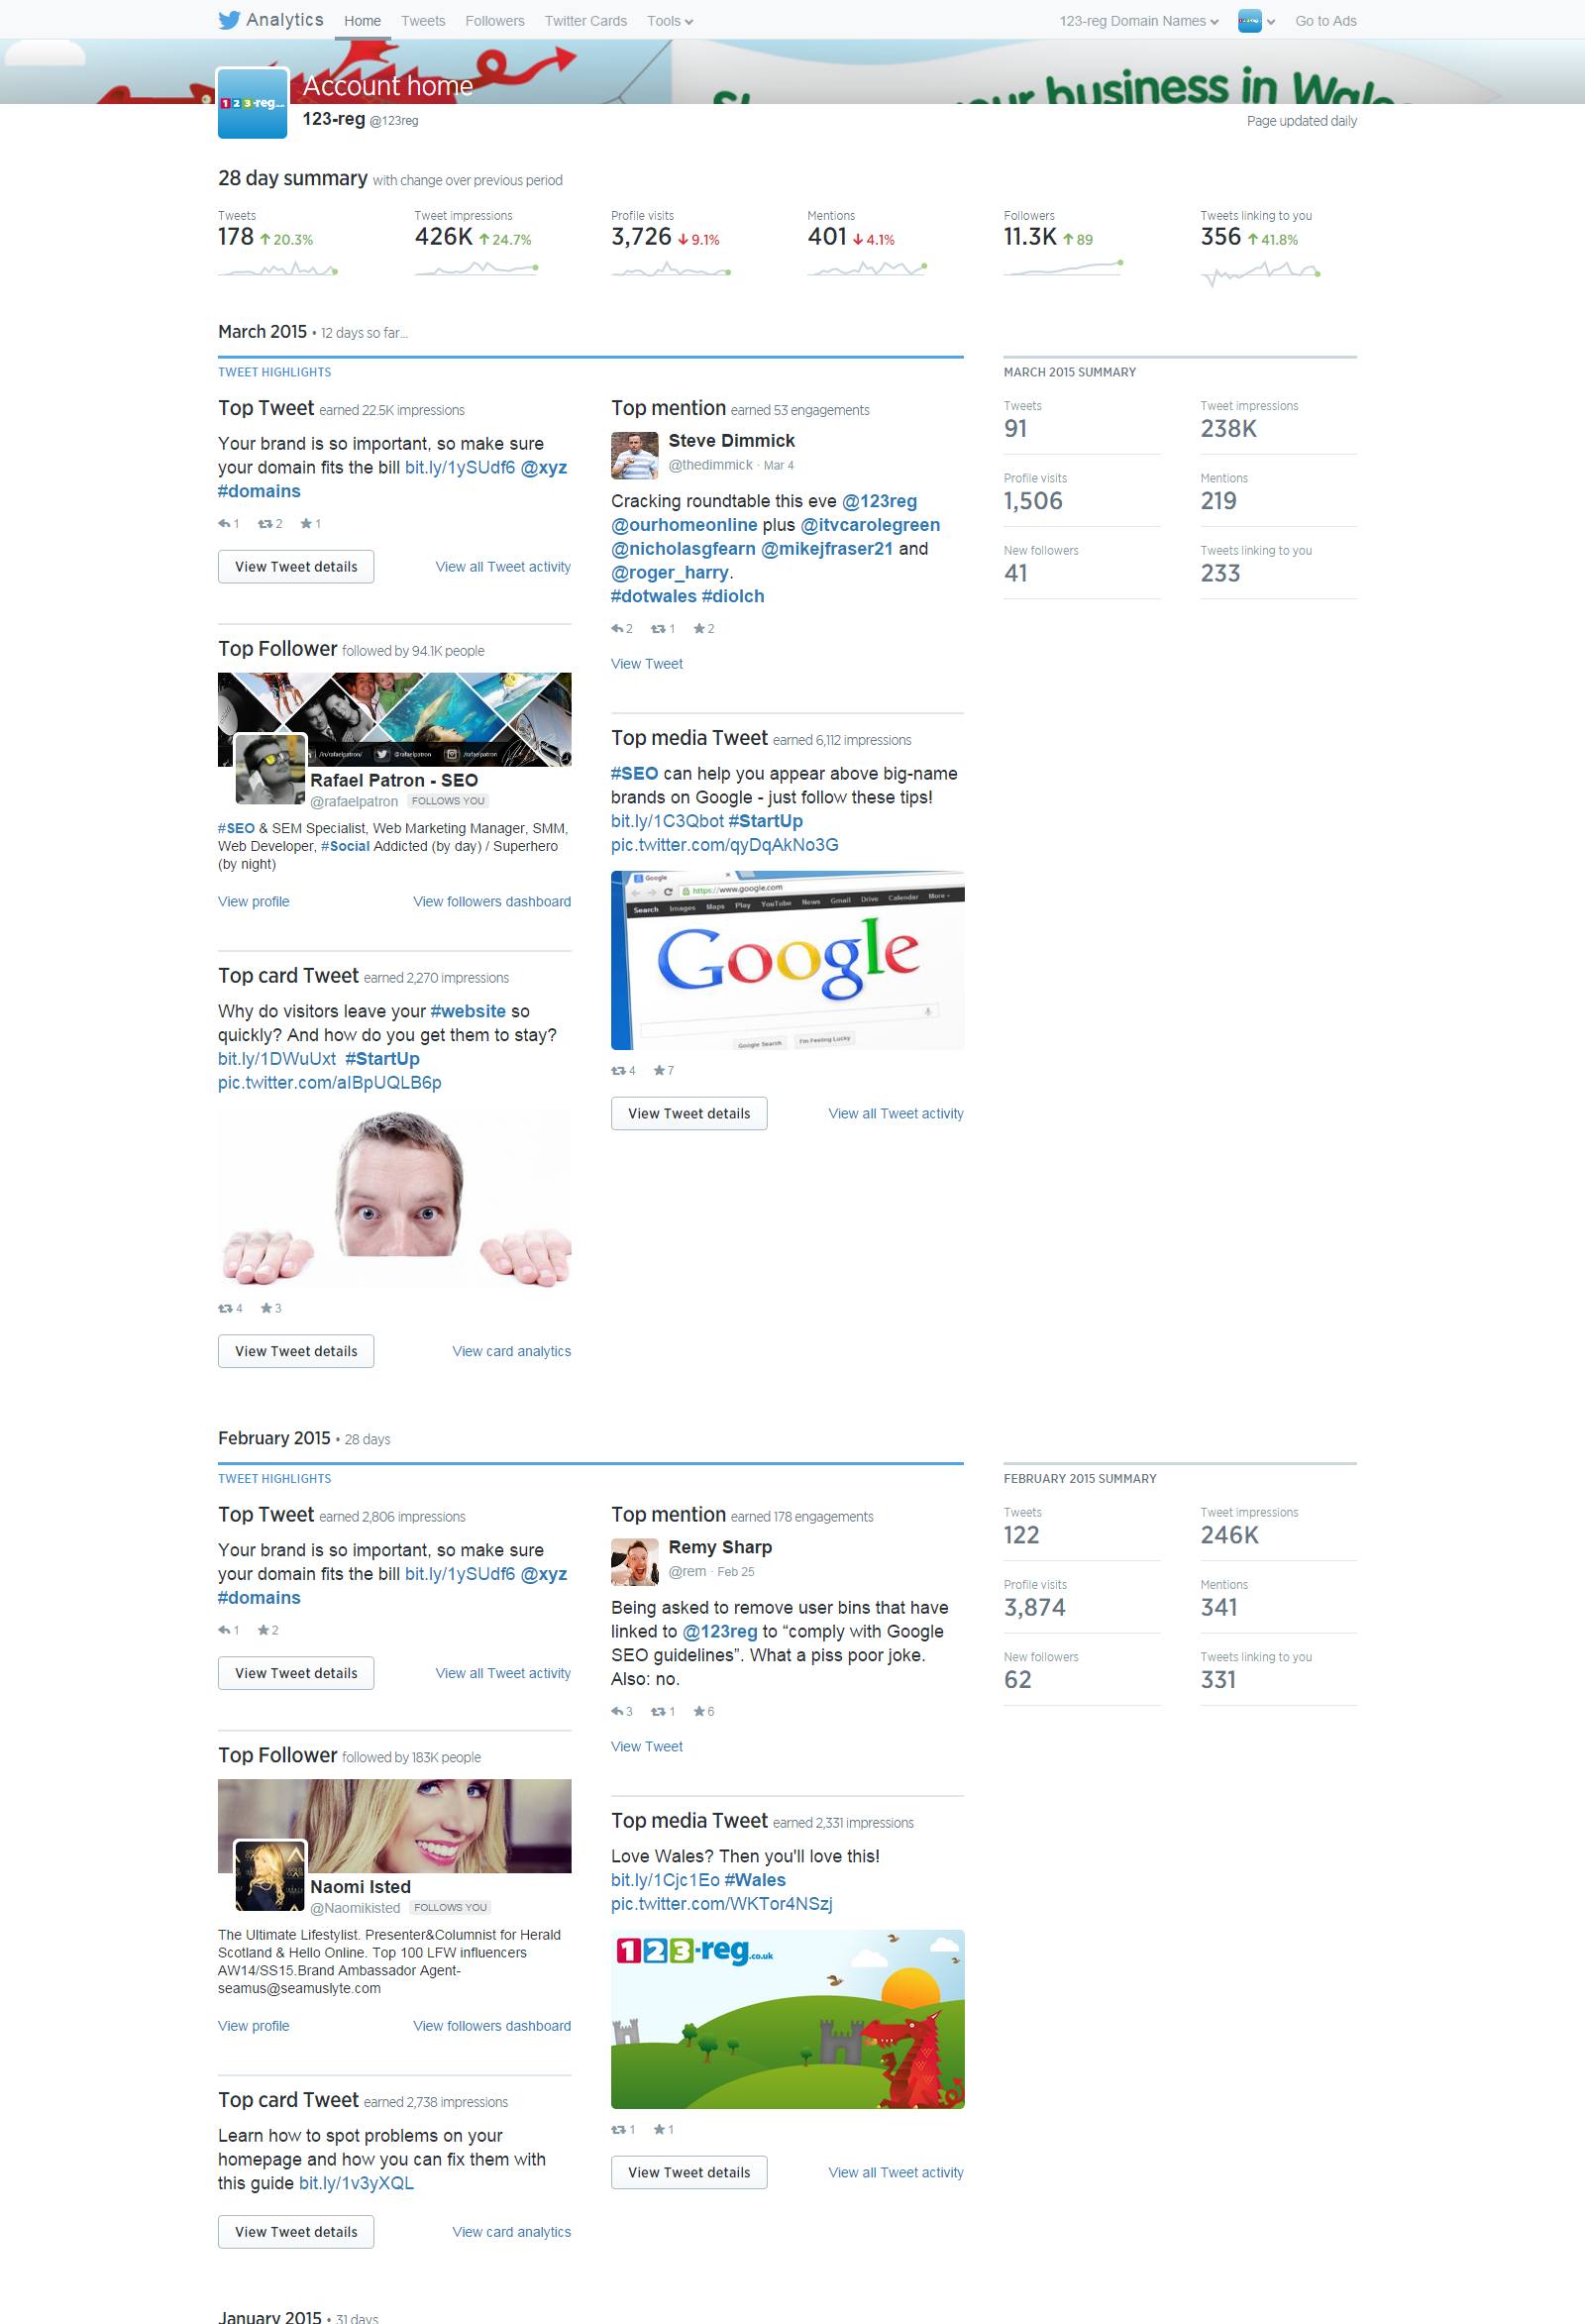
Account home
The first thing you see in Twitter analytics is an overview of your activity during the 28 days, with a comparison to the previous period. This gives you a good indication of whether you’re heading in the right direction, but don’t get too hung up on it.
Below that is a summary of your top performing tweets over the last few months. Pick out your best performing tweets and brainstorm similar ideas to see if you can repeat the success. Also take note of your top followers and top mentions. Are these people you can contact in order to form a mutually beneficial relationship?
Tweets
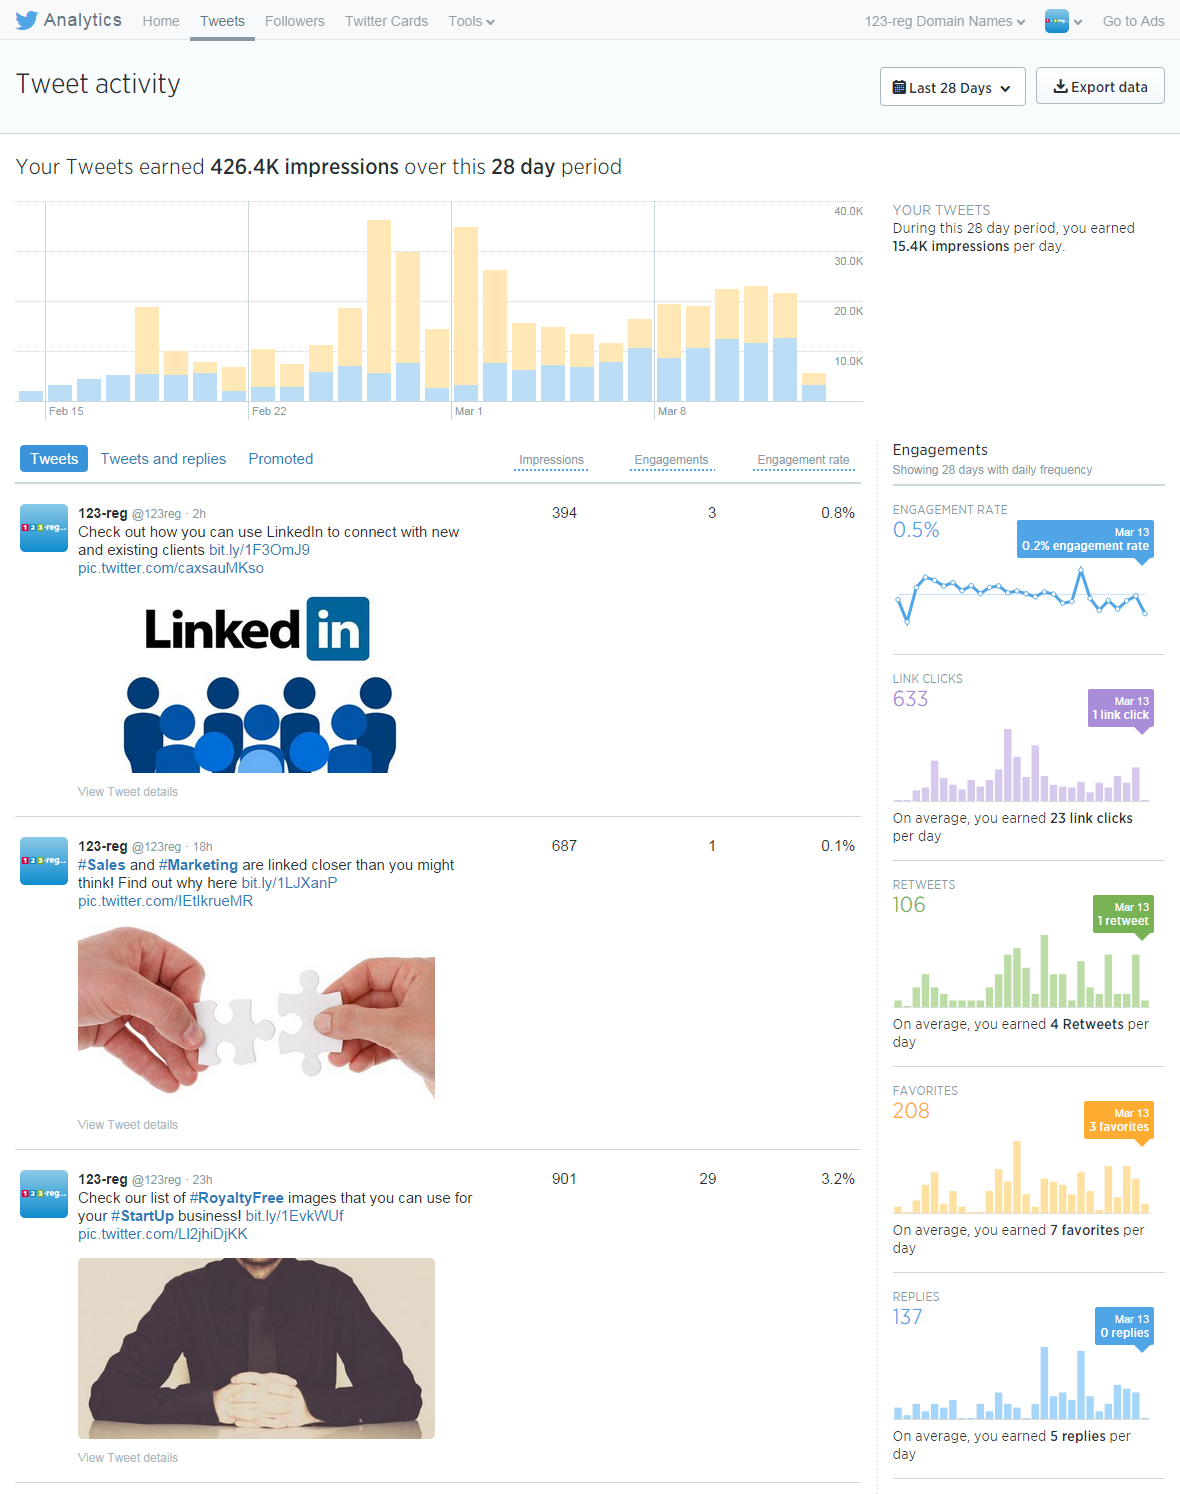
You can dig deeper into how your Tweets performed in the tab of the same name.
At the top of this page, there’s a graph showing the number of impressions your tweets have achieved, while below that is a breakdown of the performance of each tweet. Again, pick out top performing tweets and use them as a basis for future tweets. You can export the data, so you may want to extract the relevant data so you can view it in a spreadsheet and organise it to your liking.
Down the side, there is a selection of graphs showing different types of engagement. Monitor these to make sure you’re providing content your followers are interested. If you set the time period to the maximum of 90 days, ideally you should see an upward trend. If you don’t, you may need to rethink your Twitter strategy.
Followers
Next up is the followers tab. At the top is a graph showing your follower numbers over the last few months. Again, this should be showing an upward trend – if not, rethink what you’re doing.
Under that, you can get more information about the interests, location and gender of your followers. There’s not much actionable information here, but it can help you understand if you’re reach the right audience. The fact that 123-reg’s followers are interested in technology, marketing, search engine optimisation and so on, shows that we’re reaching people who are a good match for the services we provide. That most of our followers are UK-based is also a good sign. If your stats show your followers aren’t interested in areas related to your product or service, or that they’re predominately from countries where you don’t do business, then you’ll need to rethink your strategy.
Twitter cards
If you’re just a beginner with social media, the chances are you haven’t set up Twitter cards. But if you have, take a look at the stats to see what impact they’ve had on engagements. We’ll cover Twitter cards in more depth elsewhere.
Further reading
This is just an overview of the easy-to-obtain stats offered by Facebook and Twitter. There’s much more to be done with social media. These guides should help you.
If you want to get started with Facebook advertising you can do that here.
If you want to get started with Twitter advertising you can do that here.
You can learn more about developing a social media action plan in this video.
And if you want to go in depth, you can learn even more about social media marketing with this on-demand webinar.


